![]()
Tanks Help Page
Tank List
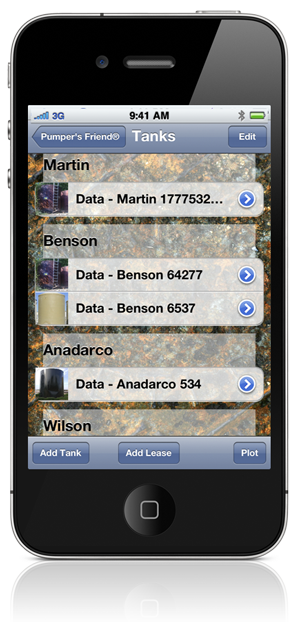
The tank list is where you keep track of the fluid levels of tanks you service. Each tank is listed by name and additional tanks can be added by selecting the “Add Tank” option.
The tanks are organized by leases so you can easily keep track of them.
If you select the “Edit” button in the upper right, you can delete or remove a tank from the list. By using the control on the right of each row, you can rearrange the rows as needed.
When a tank is added it is placed in an “Uncategorized” group. In order to associate a tank with a lease, you must move the tank to the proper lease using the edit feature. As a convenience, you can add a lease from the Tank screen by selecting the “Add Lease” button at the bottom.
By selcting the “arrow” button on the right of each row, you can update the information for an individual tank.
Data & Plot
These two options allow you to either gather tank level data or plot tank level data for the individual tank selected.
At the bottom of the screen is a button labeled “Plot.” If you touch the button, you will notice that the word “Plot” appears in front of each tank name, and a plot icon appears, indicating plot mode. In this mode, when a row is selected, a data plot will appear for that tank.
If the “Data” button is visible, touching it will place the mode back into data mode, showing a small image of the tank. When a row is selected in the data mode, The tank level screen will appear.
Add & Update Tank Information
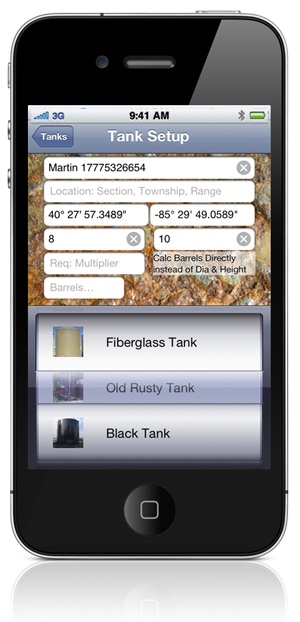
If you select the “add tank” or the “arrow” button beside a tank name, the setup screen is displayed. This screen allows you to add or modify tank information.
The name field is always required, and for tanks you must enter the diameter and height, in order for the program to be able to calculate the number of barrels from the level reading you will enter.
Alternatively you can supply a “multiplier” that will be used to calculate the number of barrels from the level reading. If the multiplier is present, the diameter and height will be ignored.
The “picker” at the bottom of the screen allows you to select a tank image. There are a variety of different tanks to choose from, and new tank images will be added with each release of the app. If you would like to submit a tank image, contact us for details.
Tank Level Data
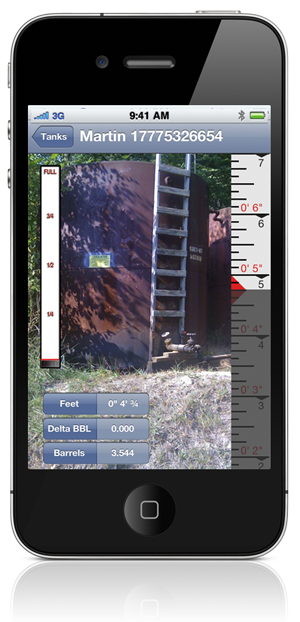
This screen is where the tank level data is entered, using the sliding ruler on the right-hand side. You will notice that as the ruler is moved, the relative fluid level is also reflected by the black bar on the side of the tank image. Additionally, there are red indicators that show the previous level recorded.
As the ruler is moved, the numeric value of the measurement in feet along with the number of barrels is shown. The “plot” button can be selected if you wish to see the data plotted.
The Ruler
The ruler is divided into 1/8 increments, and is designed to read like a measuring tape or stick. As the ruler is moved “down,” it is analogous to dropping the tape into the tank. As you move the ruler “up,” it is as if you are pulling the tape up, out of the tank. The black strip is similar to the oil on the tape, and when the reading is taken, the ruler should look like the tape, where the oil level is.
If you wish to move the level quickly from top to bottom, you can move your finger up and down the tank level indicator on the left. The ruler will track the level.
Saving Data
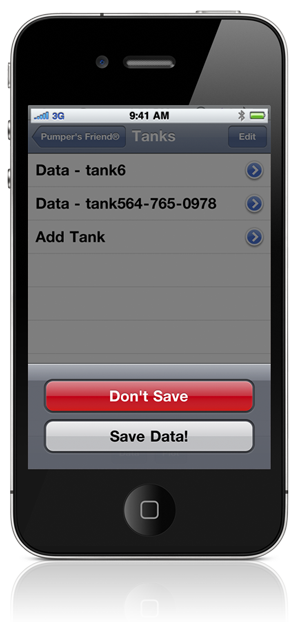
Whenever you leave the tank level screen, you have the option to either save, or discard the data.
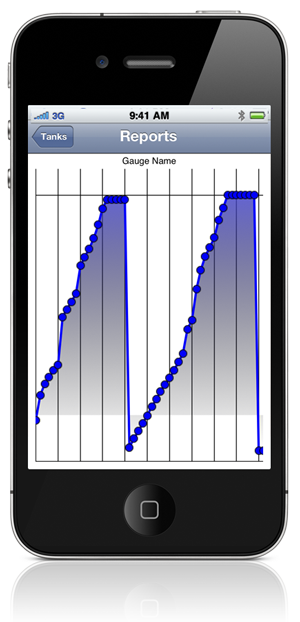
Tank Plot
The tank plot displays the data collected from each tank reading. At a glance, you can see the daily levels, and determine if the fill rates are normal, and see when the tank was emptied.
The graph can be moved and scaled with finger gestures for viewing specific areas in more detail.

Recent Comments