Tank Level Data
One thing I found out in talking to folks in the field is that the tank level measurement is one of the most important measurements taken every day. In fact at some fields, it may be the only measurement taken.
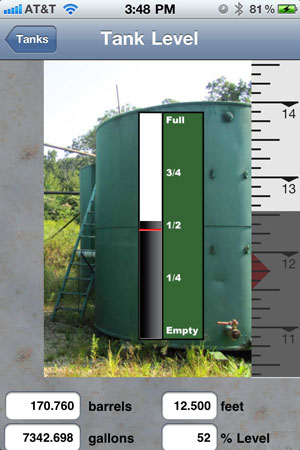
I’ve put together a prototype screen for entering tank level data based on my field visits. There were some great suggestions which I have tried to incorporate into this screen concept.
Visually I wanted to give users a quick view of the relative level of the fluid in the tank. As you can see this is done with a black bar against a picture of a tank. I also added in some indications along the bar to indicate 1/4, 1/2, 3/4 full.
The other important visual element is along the right hand side of the screen. This graphic represents the measurement of the gauge stick or tape. The ruler graphic slides up and down as the user locates the correct measurement. The semi-transparent black stripe indicates the fluid level and is static – the numbers slide by.
The ruler is divided into eighths of an inch and the tic marks are far enough apart that it is easy to move it to the desired reading. The slider is also fast enough that it can be moved from the top of the tank to the bottom quickly.
The ruler is numbered from top to bottom with increasing values. I tried to simulate what the operator would see as they pulled the stick or tape from the tank – number value decreasing as the tape is pulled out until it reaches the oil mark.
Another feature of this screen is the red mark indicating the previous days level. You can see the red triangle on the ruler showing the previous days reading was 11 feet and 3/4 inches at the tip of the triangle. The red line on the tank strip also shows the previous days reading.
At the bottom of the screen are the numbers we all want to see. The program can calculate any type of conversion needed, and I think most users will need the barrels reading. If you need to see other calculations such as the amount of change since the day before, let me know.
I know you are asking: how I can calculate the barrels from the measured level if I don’t know the tank size? In this example I assumed a 20 foot round tank with a 10 foot diameter. When the program is first set up, the user will need to answer a few simple questions about the tank size before they can enter any data.

Historical Data Plots
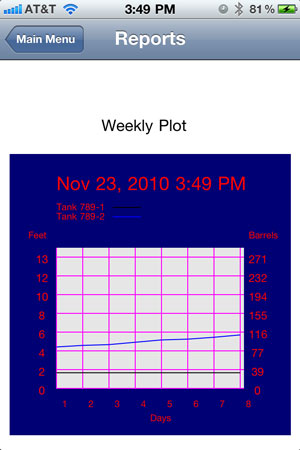
The next area I looked at was plotting historical data. Data can be plotted any number of ways, and if you have input on what is the most meaningful display for pumpers, please let me know.
What you see here is an idea of the basic elements I think are needed in the field. This plot displays two different tank levels. One level is displayed with a black line and the other with a blue line. The duration of the plot is 8 days and the vertical scale can be read in either feet or barrels.
As you can see the black line doesn’t change through the week, while the blue line moves steadily up each day, between 4 and 6 feet. This represents a pair of storage tanks where one tank is filled at a time. When one tank is full, the pumper will switch to the other tank and call for a pickup.

Recent Comments